
Maximizing Prescription Capture Rates at Medically Integrated Dispensing Sites: The Role of Limited Specialty Network Models in Oncology
By ION
Introduction
Specialty drugs continue to grow, and significantly, they are projected to account for 43% of global spending on medications by 2028, with oncology and immunology being the leading therapeutic areas . There is no standard definition for what constitutes a specialty drug, but in general they:
• Are expensive
• Treat rare, complex, or chronic conditions
• Require special handling
• Require specialized administration by a clinician[i]
From a cost standpoint, Medicare recognizes the specialty tier threshold for part D formularies starts at $950 for 30-day equivalent ingredient cost[i]. Due to these specialty drug characteristics, manufacturers often create limited or exclusive networks. The manufacturer specifies the eligible pharmacy locations, and pharmacies that are excluded from the network are unable to purchase and dispense the product[ii].
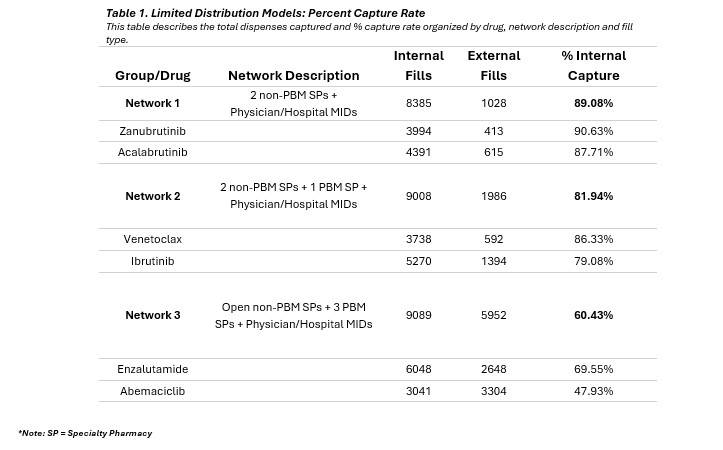
This paper examines a few of these limited distribution network (LDN) models – referred to as Network 1, Network 2, and Network 3 – and how the network makeup impacts the capture rate of prescriptions at medically integrated dispensing (MID) sites within private oncology practices. Each network is represented by two specialty drugs measured across 26 physician-based medically integrated dispensing sites (MIDs) spread amongst 15 different states for all of 2024.
Network 1 includes Zanubrutinib[iii] and Acalabrutinib Maleate[iv] which have a limited distribution network with two specialty pharmacies that are not owned by a Pharmacy Benefits Manager (PBM) and includes physician and hospital MIDs. Network 2 includes Ibrutinib[v] and Venetoclax[vi] which have a limited distribution network with two specialty pharmacies that are not owned by a PBM and one specialty pharmacy that is owned by a PBM. It also includes physician and hospital MIDs. The third network includes Enzalutamide[vii][viii] and Abemaciclib[ix] and has a more open specialty network, including PBM-owned specialty pharmacies. Enzalutamide has 13 specialty pharmacies as well as physician and hospital MIDs, while Abemaciclib has eight specialty pharmacies plus physician and hospital MIDs.
We hypothesize that the network type influences the capture rate with certain configurations facilitating higher internal dispensing. This investigation aims to provide evidence to inform practice strategies and enhance patient access to specialty medication.
Methodology
Study Design: This observational study utilized claims data collected from an internal proprietary database combined with externally filled prescriptions obtained using a large national database. The fills (new and refill prescriptions) for six drugs were reviewed- Zanubrutinib, Acalabrutinib, Venetoclax, Ibrutinib, Enzalutamide, and Abemaciclib. Capture rate is defined as the ratio of prescriptions dispensed internally (dispenses filled through our MID sites) to the total number of prescriptions filled, including both internal and external dispensations.

• Network 2: Two drugs (Ibrutinib + Venetoclax)
• Network 3: Two drugs (Abemaciclib + Enzalutamide)
Results
This study was not designed to demonstrate the benefits of medically integrated dispensing, but there is a growing body of studies that supports this modelxi,xii.
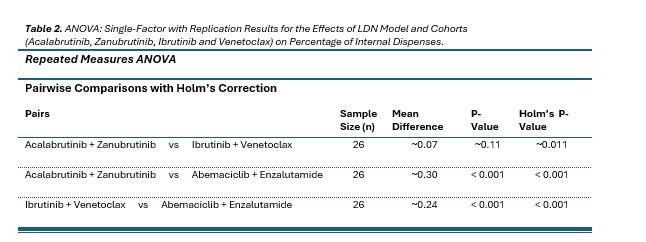
Results from repeated measures ANOVA analysis revealed a statistically significant effect of network model on capture rates (p < 0.001). This strong significance supports the rejection of the null hypothesis, indicating that the type of distribution model significantly influences the ability to capture specialty drug dispenses.
To further explore these differences, post-hoc pairwise comparisons were conducted using Holm’s correction to control for multiple testing. The analysis compared three limited distribution models: Network 1, Network 2, and Network 3. Results showed that both Network 1 and Network 2 had significantly higher capture rates than Network 3 (corrected p < 0.001 for both comparisons). However, the difference between Acalabrutinib + Zanubrutinib and Ibrutinib + Venetoclax was not statistically significant (corrected p ≈ 0.11).
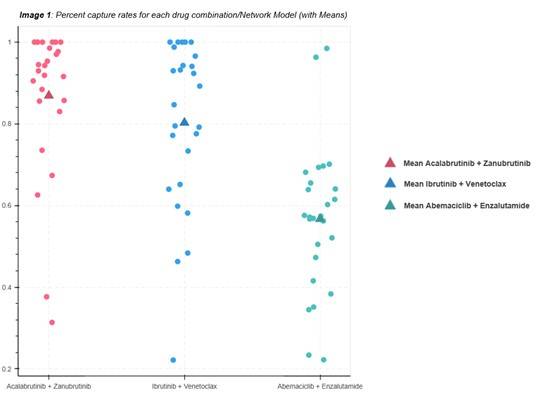
Based on the scatter plot visualizing the mean capture rates and data distribution for the three drug combinations across different network models, here are some key observations:
• Acalabrutinib + Zanubrutinib (Red): Data points are tightly clustered between 0.8 and 1.0, indicating consistently high capture rates.
• Ibrutinib + Venetoclax (Blue): Shows a broader spread from 0.2 to 0.8, reflecting greater variability in capture rates.
• Abemaciclib + Enzalutamide (Green): Most data points fall between 0.2 and 0.6, with fewer outliers, suggesting lower and more consistent (but underperforming) capture rates.
Network 1 consistently achieves higher capture rates, as evidenced by its tight clustering near the upper end of the scale. In contrast, whereas Network 2 exhibits a broader distribution, suggesting more variability in performance across different settings or practices. Network 3, with the lowest mean and narrower range, appears to be the least effective network model overall.
These findings suggest that the network configurations or practice characteristics associated with Network 1 and Network 2 are more effective in capturing specialty drug dispenses compared to those linked to Network 3’s model. The notably higher mean capture rate of Network 1, (89.08%) compared to Network 2 (81.94%), underscores its performance. However, the lack of statistical significance between these two may be due to the higher variability within Network 2 or the limitations in the sample size reflected in the degrees of freedom (Denominator DF = 50).
Summary of Findings
In the context of this study, which examines how network models affect capture rates at MID practices, these findings imply that the structural or operational factors tied to Network 1 and to Network 2 enhance their superior ability to secure specialty drug dispenses.
The lower efficacy of the Abemaciclib + Enzalutamide in Network 3 may warrant further investigation into barriers specific to these drugs, such as cost, availability, or clinical suitability with the studied networks.
While the precise mechanisms driving these differences remain beyond the scope of the current data, this study supports prioritization of the Network 1 and Network 2 models in strategies aimed at optimizing capture rates in oncology practices.
Implications of the Findings
1. Network Model Matters:
The statistically significant differences in capture rates across network models suggest that how a specialty drug is distributed - particularly the structure of the dispensing network - has a substantial impact on performance.
2. Superior Performance of Limited Networks:
The Acalabrutinib + Zanubrutinib combination, in Network 1, is associated with a more limited network (2 non-PBM SPs + Physician/Hospital MIDs), consistently achieved the highest capture rates (~90%). This implies that tighter, more controlled networks may be more effective in retaining specialty drug dispenses within preferred channels.
3. Variability in Broader Networks:
Ibrutinib + Venetoclax in Network 2, which includes a PBM SP, showed greater variability in capture rates. This suggests that broader networks may introduce inconsistencies in performance, possibly due to differences in payer dynamics, provider engagement, or patient access pathways.
4. Underperformance of PBM-Dominated Models:
The Abemaciclib + Enzalutamide model, in Network 3, which includes multiple PBM SPs, had the lowest and least variable capture rates (~40%). This underperformance may reflect systemic barriers in PBM-heavy networks that hinder internal dispensing.
5. Strategic Implications for Manufacturers:
Pharmaceutical manufacturers aiming to maximize internal dispensing through private oncology MIDs may benefit from favoring more selective, non-PBM-centric network configurations. These models appear to better support capture rate goals and may offer more predictable outcomes.
[iv]https://www.calquencehcp.com/content/dam/open-digital/hcp-cal/us/en/pdf/calquence-access360-enrollment-form.pdf
[vii] https://www.astellaspharmasupportsolutions.com/products/xtandi/pharmacies_distributors/index.asp


.jpg?h=320&iar=0&w=540&useCustomFunctions=1¢erCrop=1&hash=30E39EA6C2134EBE03BACCAB21503D46)